30 Claude Prompts to Improve Your Amazon Business Performance

Sellerise Team, Contributor
11 min read -
Updated:Amazon sellers have access to more data than ever.
Sales, profit, advertising, fees, refunds, inventory, reviews, keyword performance, and reimbursements can all contain important signals about the health of a business.
The challenge is knowing what to look for.
A dashboard can show that ACoS increased. It does not always immediately explain which campaigns caused the increase, why their performance changed, or where you should begin your investigation.
This is where AI can become useful.
When Claude is connected to your Sellerise workspace through Sellerise MCP, it can work with the Amazon seller analytics, such as finances, reviews, inventory, keywords, PPC, competitors, reimbursements available to your account. Instead of manually exporting reports and explaining every column, you can ask questions about your business in normal language. The connection is optional, user-authorized, and read-only.
But the quality of the answer still depends heavily on the quality of the question.
This guide gives you 30 practical Claude prompts for analyzing your Amazon business, finding potential problems, and deciding what to investigate next.
How to Write Better Claude Prompts for Amazon Analysis
You do not need to learn complicated prompt engineering.
A useful Amazon business prompt normally includes five elements:
- The goal: What are you trying to understand?
- The scope: Which account, marketplace, product, or campaign should Claude analyze?
- The period: Which dates should it use?
- The comparison: What should the current result be compared against?
- The output: How should Claude organize the answer?
For example, this question is too broad:
“How is my business doing?”
A stronger version would be:
“Analyze my Amazon business performance for the last 30 days and compare it with the previous 30 days. Include revenue, net profit, margin, PPC spend, refunds, and the five biggest changes. Present the results in a table and finish with the three issues I should investigate first.”
The second prompt gives Claude a timeframe, metrics, comparison period, format, and clear objective.
Reusable Amazon Analysis Prompt Template
Use this structure whenever you create your own prompt:
“Analyze [business area] for [account, marketplace, ASIN, SKU, or campaign] during [date range]. Compare it with [comparison period]. Focus on [metrics]. Identify [problems, opportunities, or changes]. Present the answer as [table, summary, or prioritized list]. Do not assume missing information. Clearly state which conclusions are supported by the available data.”
This last instruction is important. It encourages Claude to separate facts from assumptions and tell you when additional information is needed.
Analyze Your Amazon Business Without Exporting Another Report
MCP, or Model Context Protocol, is an open standard that allows AI applications to connect to external tools and data sources.
Without a connection, Claude can explain Amazon strategy or analyze information you paste into the conversation. However, it cannot automatically see what is happening in your Amazon business.
Sellerise MCP connects Claude to the account, marketplace, product, financial, advertising, and performance information available through your Sellerise workspace. The connection does not allow Claude to change listings, prices, campaigns, inventory, orders, payments, or Sellerise settings.
To connect Sellerise:
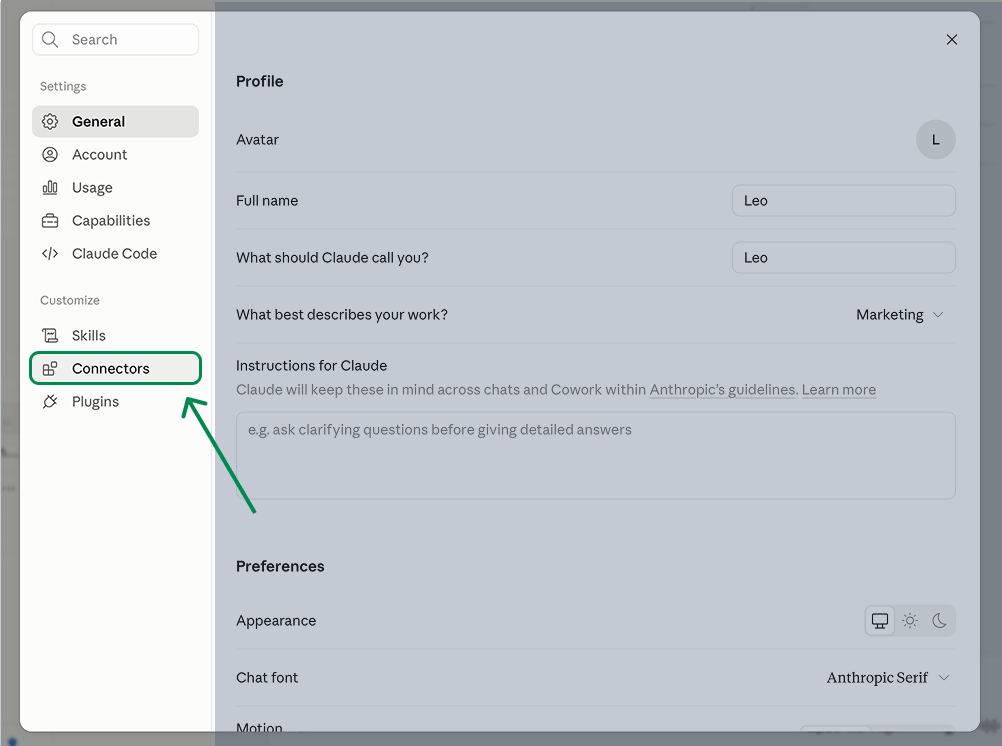
- Open Claude and go to Settings.
- Select Connectors.
3. Find Sellerise.
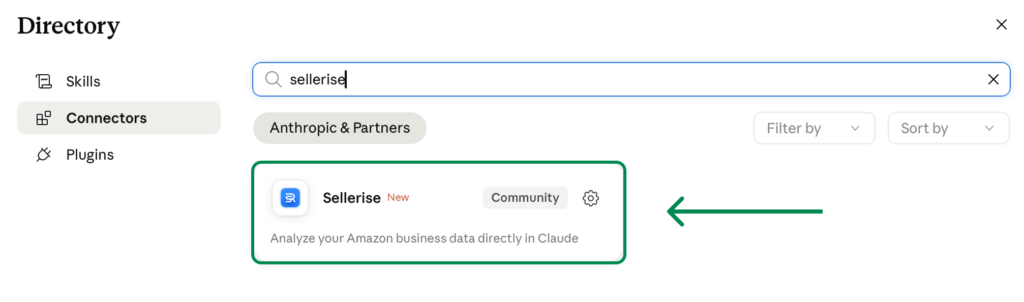
4. Follow the authorization steps to connect your Sellerise account.
5. Open a new conversation and make sure Sellerise is enabled in the Connectors section.

Claude Prompts for Amazon Business Analysis
Once the connection is active, try the following prompts.
1. Get a Complete Business Overview
Start with a high-level report before investigating individual products or campaigns.
Prompt 1: Create a 30-Day Business Summary
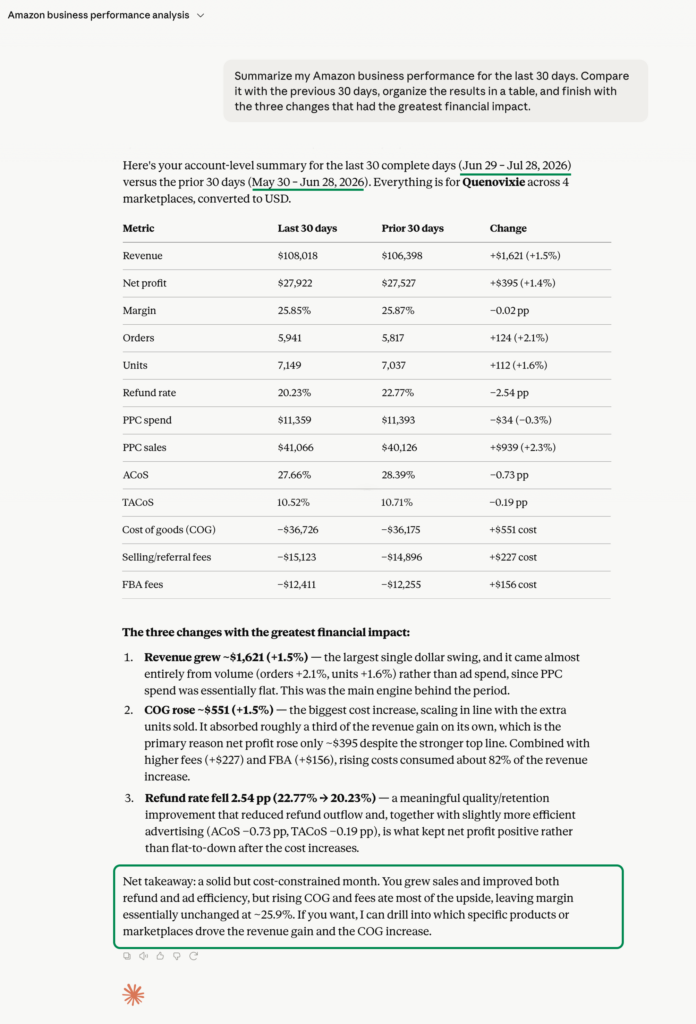
“Summarize my Amazon business performance for the last 30 days. Include revenue, net profit, profit margin, orders, units sold, advertising spend, refunds, and any other major cost changes. Compare the results with the previous 30 days and highlight the five most important changes.”
Prompt 2: Find Unusual Changes
“Review my daily Amazon performance for the last 30 days and identify unusual increases or decreases in sales, profit, ad spend, refunds, fees, or orders. Show the date of each anomaly, quantify the change, and explain which products or business areas contributed to it.”
Prompt 3: Separate Revenue Growth From Profitable Growth
“Compare revenue growth and net profit growth for the last eight weeks. Identify any weeks when revenue increased but profit decreased. For each week, explain which expenses, products, refunds, fees, or advertising changes contributed to the difference.”
Prompt 4: Compare Marketplaces
“Compare the performance of all my Amazon marketplaces for the last 30 days. Include revenue, net profit, margin, orders, advertising spend, and refunds. Rank the marketplaces by net profit and identify where performance improved or declined most compared with the previous 30 days.”
2. Analyze Profit and Margins
Revenue can increase while actual profitability becomes weaker. Sellerise provides financial data that can include revenue, fees, refunds, COGS, advertising costs, and net profit, depending on the information available in the connected workspace.
Prompt 5: Find the Biggest Causes of a Profit Drop
“My net profit decreased during the last 30 days compared with the previous 30 days. Identify the products and cost categories responsible for the decline. Quantify the financial impact of advertising, Amazon fees, refunds, COGS, and changes in sales volume.”
Prompt 6: Create a Product Margin Breakdown
“Analyze profit margin by ASIN and SKU for the last 30 days. Show revenue, net profit, margin, advertising cost, refunds, Amazon fees, and COGS. Rank the products from strongest to weakest margin and flag products with a margin below [X%].”
Prompt 7: Find Products That Sell but Do Not Generate Enough Profit
“Identify products with strong sales but weak or negative net profit during the last 30 days. Explain why each product is underperforming and show whether the main cause is advertising, fees, refunds, COGS, discounts, or another available expense.”
Prompt 8: Build a Profit Improvement Plan
“Review my product profitability for the last 30 days and identify the five largest opportunities to improve net profit. Estimate the potential financial impact of each opportunity using the available data. Separate confirmed findings from assumptions and rank the opportunities from highest to lowest impact.”
3. Improve Amazon PPC Performance
Advertising analysis becomes more useful when you move beyond asking whether ACoS is ‘good’ or ‘bad.’
The goal is to identify what changed, where money is being lost, and which areas may deserve additional investment.
Prompt 9: Find Wasted Advertising Spend
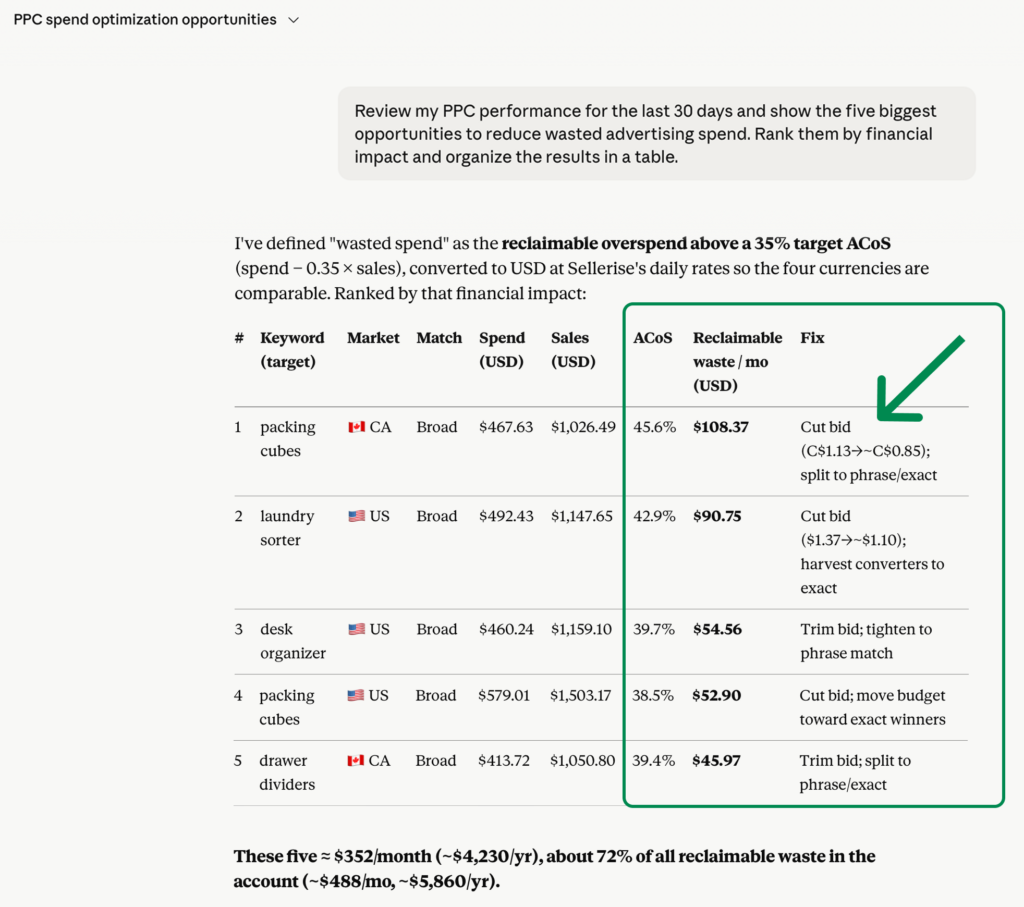
“Review my Amazon advertising performance for the last 30 days. Identify campaigns, ad groups, targets, keywords, or search terms that spent money without generating enough attributed sales. Show spend, sales, orders, ACoS, and the amount of potentially inefficient spend.”
Prompt 10: Explain Why ACoS Increased
“Identify the products and campaigns with the largest ACoS increase during the last 30 days compared with the previous 30 days. Determine whether the increase was associated with higher CPC, lower conversion, lower sales, increased spend, or a combination of factors.”
Prompt 11: Find Search Terms Spending Without Orders
“Show search terms that received clicks and generated advertising spend but no orders during the last 30 days. Rank them by spend and include clicks, CPC, spend, and the campaigns where they appeared. Group the results by product.”
Prompt 12: Find Winning Search Terms
“Identify search terms with the strongest advertising performance during the last 30 days. Prioritize terms with multiple orders, efficient ACoS, and consistent conversion. Show which campaigns currently use each term and explain which terms may deserve further investigation for expansion.”
Prompt 13: Compare Campaign Types
“Compare the performance of my automatic, broad, phrase, exact, product-targeting, and other available campaign types during the last 30 days. Include spend, attributed sales, orders, ACoS, ROAS, CPC, and conversion rate. Explain where each campaign type is performing best or worst.”
Prompt 14: Prioritize PPC Actions by Financial Impact
“Review my PPC performance and recommend the five campaign areas I should investigate first. Rank them by estimated financial impact rather than by percentage change alone. For each one, show the supporting metrics, the likely issue, and the next manual action to consider. Do not make any campaign changes.”
4. Understand Product and ASIN Performance
Account-level totals can hide what is happening at the product level.
One fast-growing ASIN may be covering a decline in several other products. A high-revenue product may also have a weak margin, rising refund rate, or inefficient advertising.
Prompt 15: Rank Your Strongest and Weakest Products
“Rank my ASINs by business performance for the last 30 days. Consider revenue, net profit, margin, units sold, advertising efficiency, and refund rate. Create separate lists for the five strongest and five weakest products and explain each ranking.”
Prompt 16: Find Products With Growing Sales but Falling Profit
“Identify ASINs where sales increased but net profit or profit margin decreased compared with the previous 30 days. Quantify the change and explain which available cost or performance metrics contributed to it.”
Prompt 17: Find Hidden Product Risks
“Review all active products and flag ASINs with concerning combinations of metrics, such as declining sales, rising advertising costs, increasing refunds, falling margin, weaker conversion, lower ratings, or inventory risk. Explain why each combination deserves attention.”
Prompt 18: Compare Two Products
“Compare [ASIN 1] and [ASIN 2] for the last 60 days. Include revenue, units sold, net profit, margin, advertising performance, refund rate, review trends, and available search performance. Explain why one product is performing better and list the three most important differences.”
5. Analyze Keywords and the Search Funnel
Search performance is not only about keyword rankings.
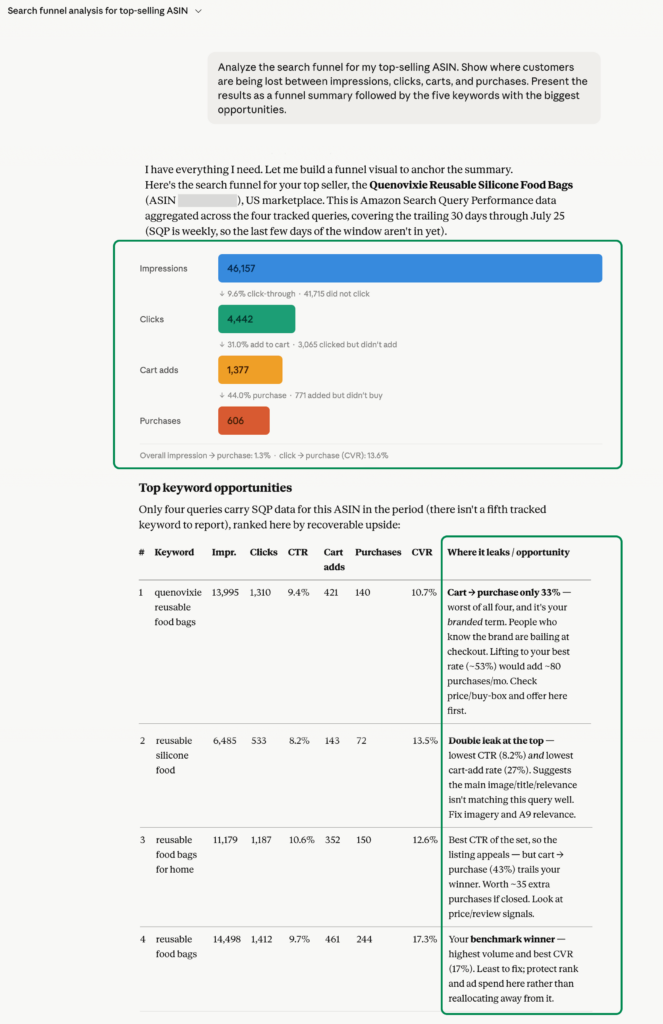
A product may receive impressions but fail to earn clicks. It may receive clicks but lose customers before purchase. Sellerise search-performance data can help analyze stages such as impressions, clicks, carts, and purchases when those metrics are available in the workspace.
Prompt 19: Find the Biggest Search Funnel Leaks
“Analyze the search funnel for my products during the last four available weeks. Identify whether the largest losses are occurring between impressions and clicks, clicks and carts, or carts and purchases. Rank the products and keywords with the most significant funnel gaps.”
Prompt 20: Find High-Impression, Low-Click Keywords
“Identify search queries with high impressions but weak click performance for [ASIN or product] during the latest available period. Compare their click-through performance with the previous period and explain which queries may indicate a main-image, title, price, or relevance problem.”
Prompt 21: Find Keywords That Attract Clicks but Not Purchases
“Show search queries that generate meaningful clicks but weak cart or purchase performance for [ASIN]. Include impressions, clicks, carts, purchases, and available share metrics. Rank the queries by the size of the conversion opportunity.”
Prompt 22: Detect Meaningful Keyword Changes
“Compare search performance for the latest available period with the previous period. Identify keywords with the largest gains or losses in impressions, clicks, carts, purchases, or market share. Explain which changes had the greatest likely impact on sales.”
6. Prevent Inventory Problems
Inventory analysis should consider more than the number of units currently available.
Sales velocity, days of cover, changing demand, and shipment timing can all affect whether a product is actually at risk.
Prompt 23: Identify Stockout Risks
“Identify products at risk of going out of stock. Show current inventory, recent sales velocity, estimated days of cover, and the approximate risk period. Rank the products by urgency and clearly state when required lead-time information is unavailable.”
Prompt 24: Find Overstocked Products
“Identify products that may be overstocked based on current inventory and recent sell-through. Estimate the available days of cover, show the value of the inventory when available, and rank the products by potential overstock risk.”
Prompt 25: Prepare a Restock Review
“Create an inventory review for my next restock decision. Group products into urgent restock, monitor, healthy inventory, and possible overstock. Use available stock levels, recent sales velocity, and days of cover. Ask me for supplier lead times or safety-stock requirements when they are not available.”
7. Learn From Customer Reviews
Reviews can reveal product defects, unclear instructions, packaging problems, sizing confusion, and mismatched customer expectations.
The objective is not only to summarize complaints. It is to find patterns that can guide product, listing, or customer-experience improvements.
Prompt 26: Summarize Negative Review Themes
“Analyze the available one- to three-star reviews for [ASIN] during the last 90 days. Group complaints into themes, show how frequently each theme appears, include short paraphrased examples, and rank the issues by severity and frequency.”
Prompt 27: Detect Growing Customer Complaints
“Compare negative review themes from the last 30 days with the previous 30 days. Identify complaints that are becoming more frequent and show which products are affected. Separate new issues from long-term recurring problems.”
Prompt 28: Turn Reviews Into an Improvement Plan
“Analyze recent reviews for [ASIN] and create three separate action lists: product improvements, listing improvements, and packaging or instruction improvements. Connect every recommendation to a specific review pattern and avoid recommendations that are not supported by the available feedback.”
8. Review Amazon Reimbursements
Reimbursement opportunities can become difficult to prioritize when sellers manage multiple products, marketplaces, and open cases.
Sellerise reimbursement data can help surface available amounts, case statuses, and opportunities that may require attention.
Prompt 29: Find Recoverable Money and Urgent Cases
“Summarize my available Amazon reimbursement opportunities. Include the total potentially recoverable amount, current case statuses, marketplaces, and any opportunities that may require urgent attention or may be approaching an expiration deadline.”
Prompt 30: Create a Reimbursement Action List
“Create a prioritized reimbursement action list. Rank open opportunities by recoverable amount, urgency, age, and current status. Show which cases require action, which are already in progress, and which appear to be completed or resolved.”
Do Not Stop After the First Prompt
One of the biggest advantages of using Claude is the ability to continue the investigation without rebuilding a report.
For example, begin with:
“Why did my profit decrease last month?”
Then continue with:
“Which three products contributed most to the decrease?”
“Separate the impact of PPC, refunds, fees, and COGS for those products.”
“Which factor had the largest financial impact?”
“Create a table showing the supporting metrics.”
“Rank the possible actions by expected financial impact.”
“Summarize the findings for my weekly management meeting.”
This process moves from a broad result to the products involved, the root causes, the financial impact, and the next decisions.

Five Instructions That Make Almost Any Prompt Better
Add one or more of these instructions to your prompts when you need a more useful answer.
1. Require a Comparison
“Compare the results with the previous equivalent period.”
A number without context may not tell you whether performance is improving.
2. Ask Claude to Quantify the Impact
“Show the estimated financial impact of every issue.”
This prevents a small percentage change on a low-volume product from receiving more attention than a smaller percentage change affecting thousands of dollars.
3. Request the Supporting Metrics
“For every conclusion, show the metrics that support it.”
This makes the output easier to review before making a decision.
4. Separate Facts From Assumptions
“Clearly separate findings supported by the data from possible explanations that require additional investigation.”
Claude can help identify patterns, but a pattern does not always prove the cause.
5. Ask for Priorities, Not a Long List
“Finish with the three actions or investigations that have the greatest estimated financial impact.”
Amazon accounts can contain hundreds of possible optimizations. Prioritization helps you focus on the issues that matter most.
Create a Recurring Amazon Business Report
You can also combine several areas into one repeatable prompt:
“Create a weekly Amazon business performance report using the latest complete seven-day period. Compare it with the previous seven-day period and include:
- Revenue, orders, units sold, and net profit
- Profit margin and major cost changes
- PPC spend, sales, ACoS, and wasted-spend opportunities
- Strongest and weakest products
- Inventory risks
- New or growing review complaints
- Search-funnel changes
- Reimbursement opportunities
Begin with a five-point executive summary. Show important comparisons in tables. Highlight changes greater than 10%, but also include smaller changes when they have a significant financial impact. Finish with the three areas the team should investigate first. Do not assume missing data.”
This can provide a useful starting point for weekly owner, agency, or team meetings.
However, the final report should still be reviewed by a person. Inventory lead times, business goals, product strategy, cash-flow constraints, and planned promotions may not always be visible in the connected data.
What Sellerise MCP Can and Cannot Do
Sellerise MCP gives Claude read-only access to the supported Sellerise information available to the account that authorized the connection. That may include connected or shared Amazon accounts the Sellerise user is permitted to access.
Claude can use that information to help you:
- Summarize performance
- Compare periods, products, and marketplaces
- Investigate profit changes
- Analyze advertising performance
- Review inventory signals
- Find customer-feedback patterns
- Examine search-funnel performance
- Prioritize reimbursement opportunities
- Build tables and management summaries
Claude cannot use the Sellerise connection to directly change:
- Advertising campaigns
- Bids or budgets
- Listings
- Product prices
- Inventory
- Orders
- Payments
- Sellerise settings
The connection is designed for analysis, not automatic account management.
That means you remain in control of every business decision and account change.
Start With One Important Question
You do not need to use all 30 prompts at once.
Start with the question that is most important to your business today:
“Why did profit change?”
“Where are we wasting advertising spend?”
“Which product needs attention first?”
“What is our biggest inventory risk?”
“What are customers complaining about?”
Then keep asking follow-up questions until you understand the cause, financial impact, and next action.
Sellerise provides Claude with the business context available in your workspace. Claude helps you investigate it through conversation.
Instead of beginning with another report, you can begin with the question you actually need answered.