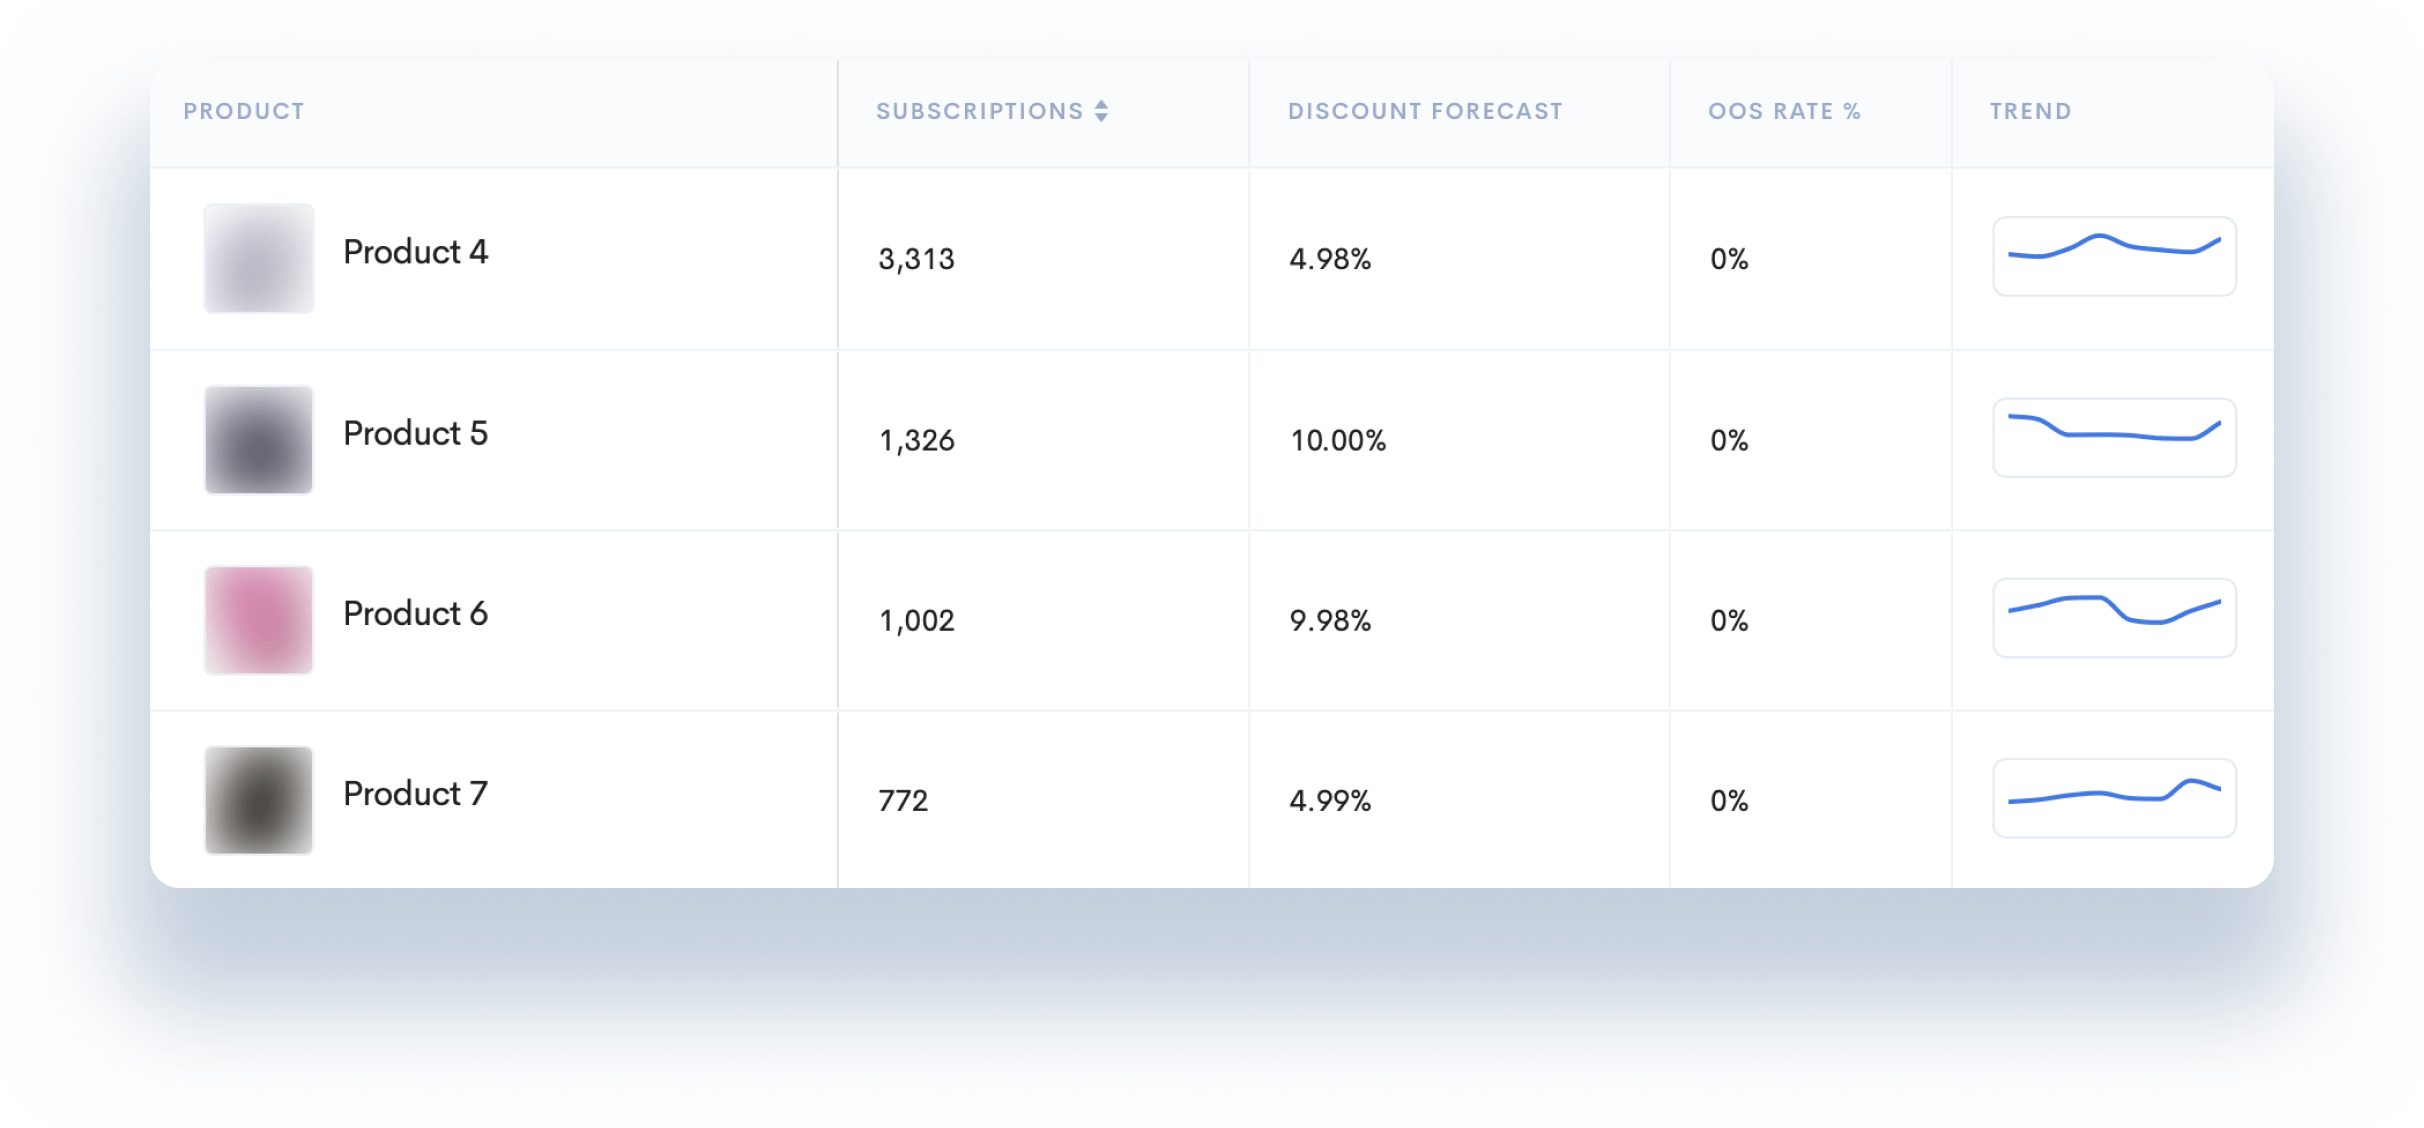
Understand how many customers use Subscribe & Save, what they buy, and how much.
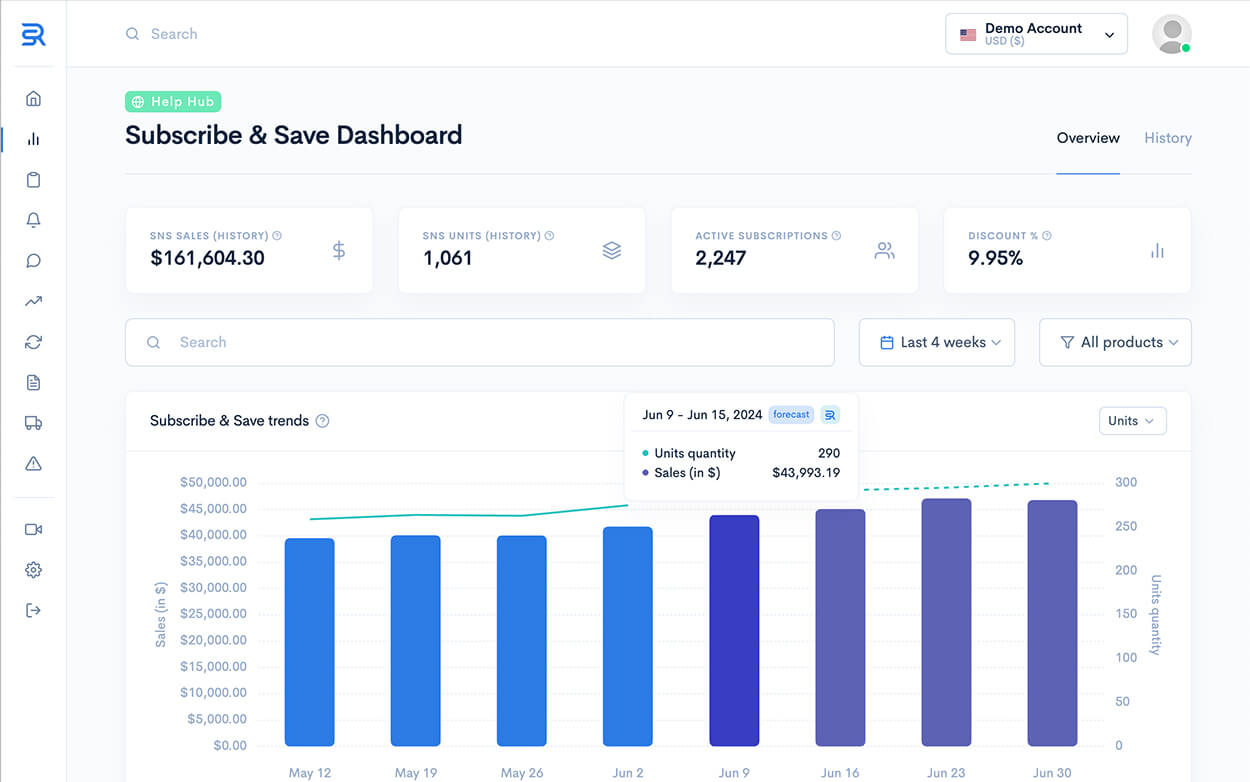

Regular subscriptions mean predictable monthly income. Our tool helps you optimize your S&S operations to ensure a steady cash flow.
With our detailed analytics and retention strategies, you can understand and influence customer behaviors to significantly lower churn rates.
Our predictive tools help you align inventory with subscriber demand, ensuring you always have just the right amount of stock.
Get a clear picture of your Subscribe & Save customers: what they're purchasing, how often, and their spending patterns.
Track the number of new unique customers enrolled in your Subscribe & Save program.
Monitor the cumulative number of orders placed by all subscribers.
Measure the overall income from subscribers to assess financial performance.




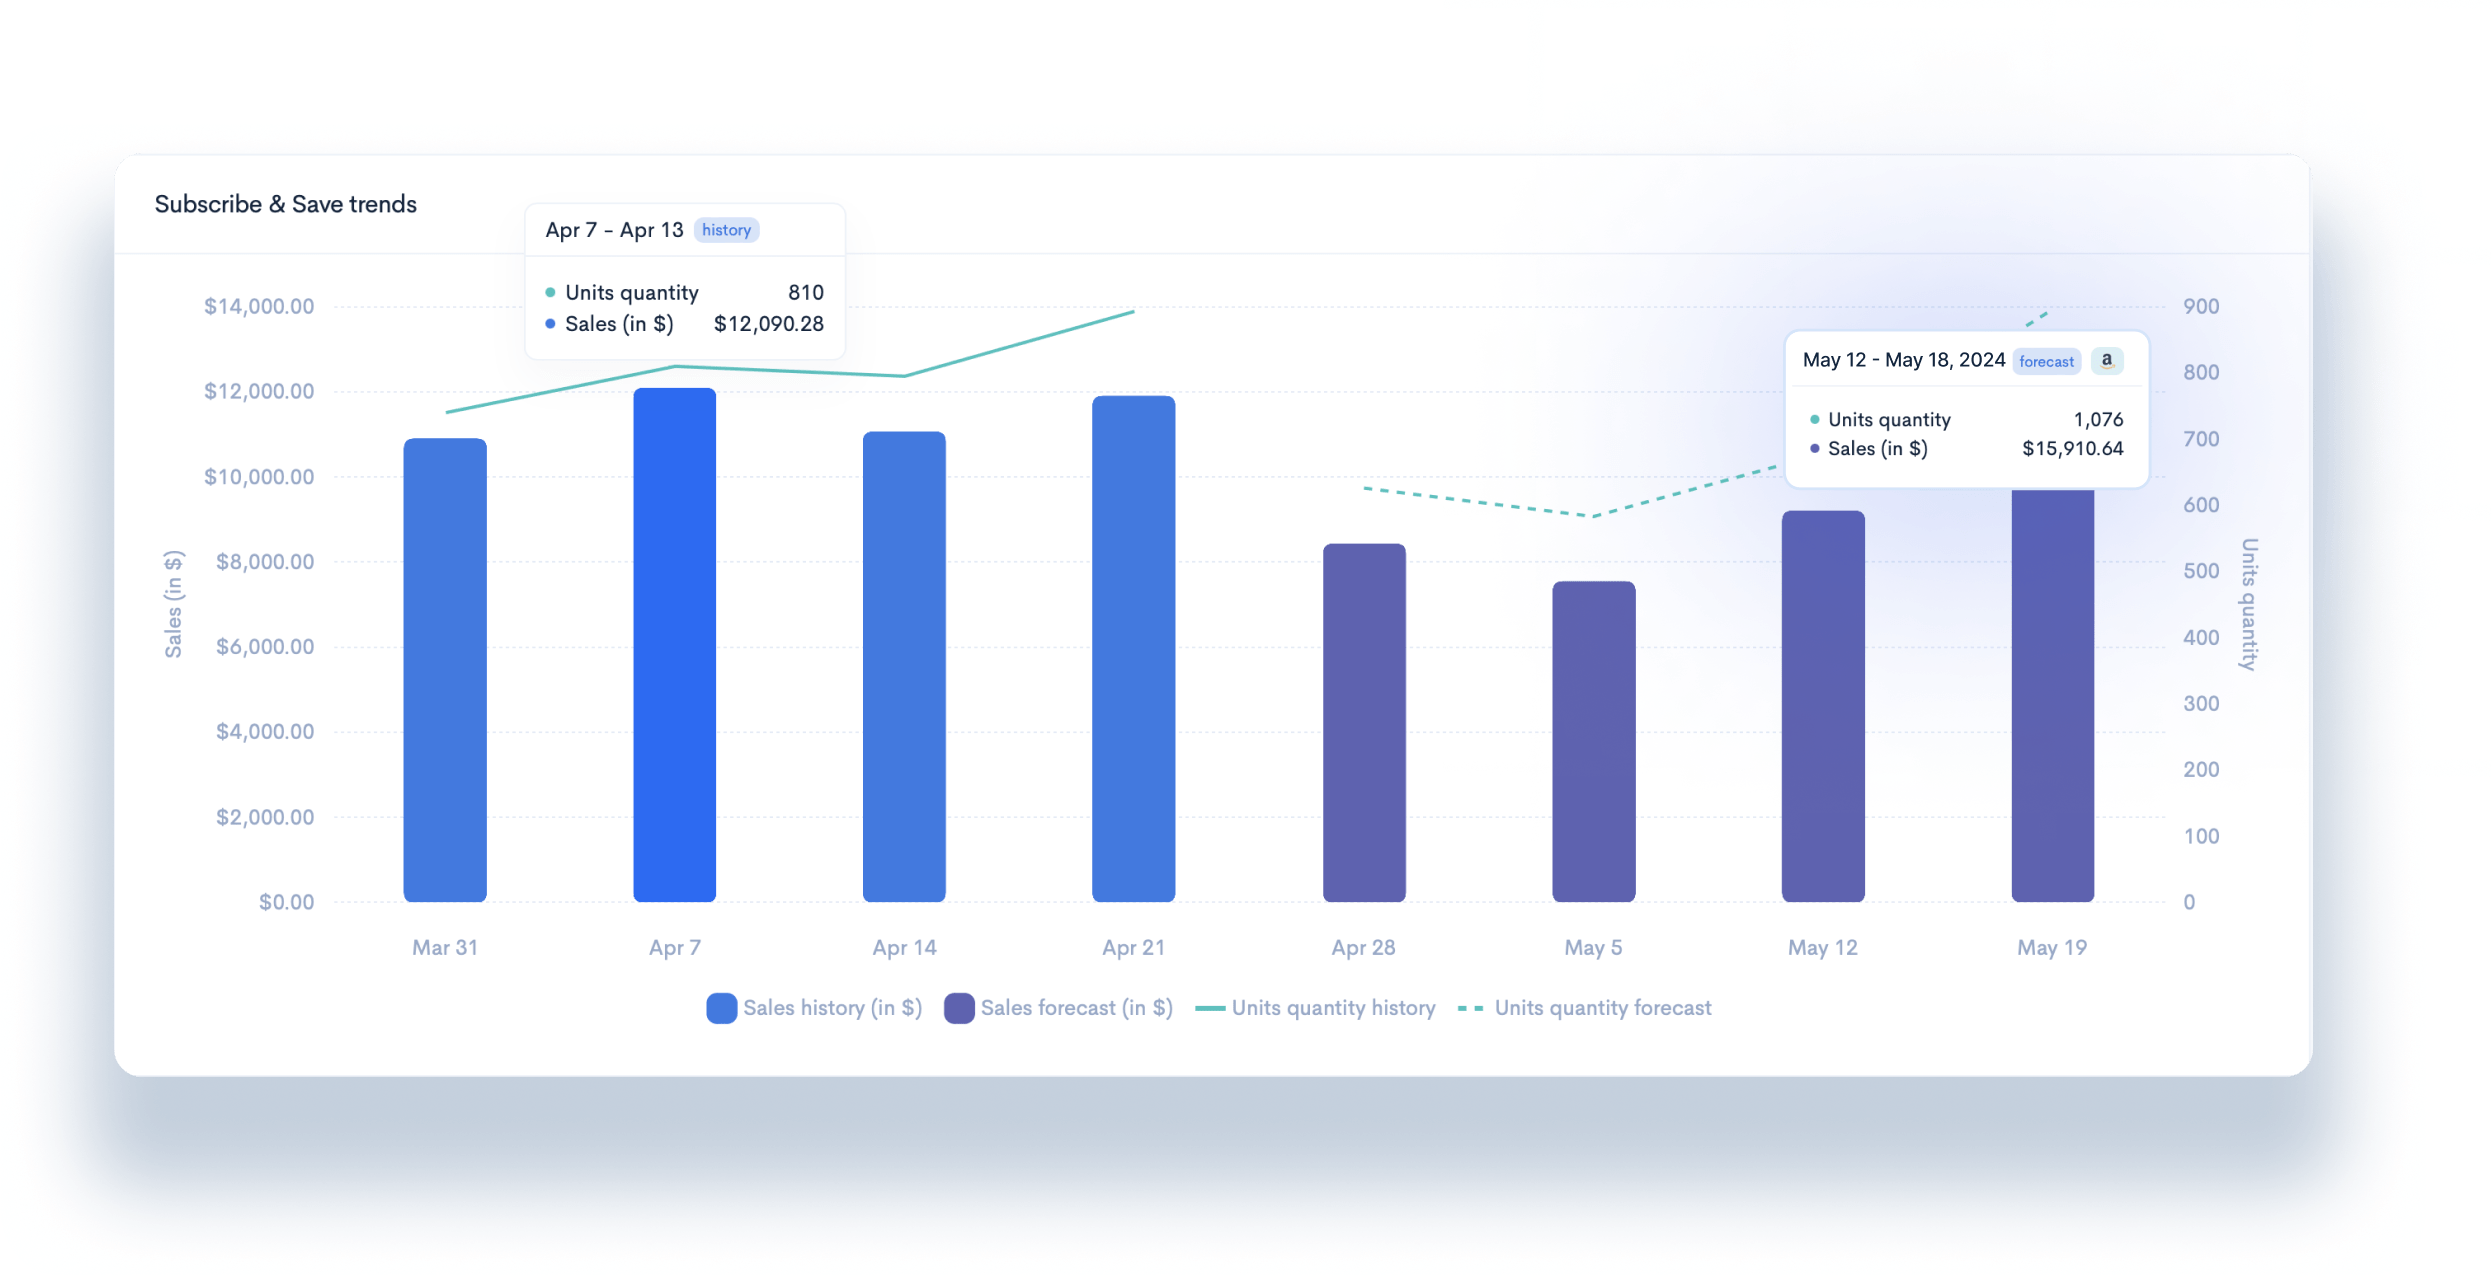

Track subscription trends week by week. See forecasts for future orders, preventing costly stock outs.
Weekly Subscription Trends
Future Order Forecasts
Revenue Projections

Get detailed insights into the average revenue per subscriber, order frequency, and more to check your performance.
See an average lifetime revenue generated by a subscriber to assess their value.
Track how many units a subscriber places on average during their SnS program.
Identify potential income lost due to out-of-stock items to improve inventory management.


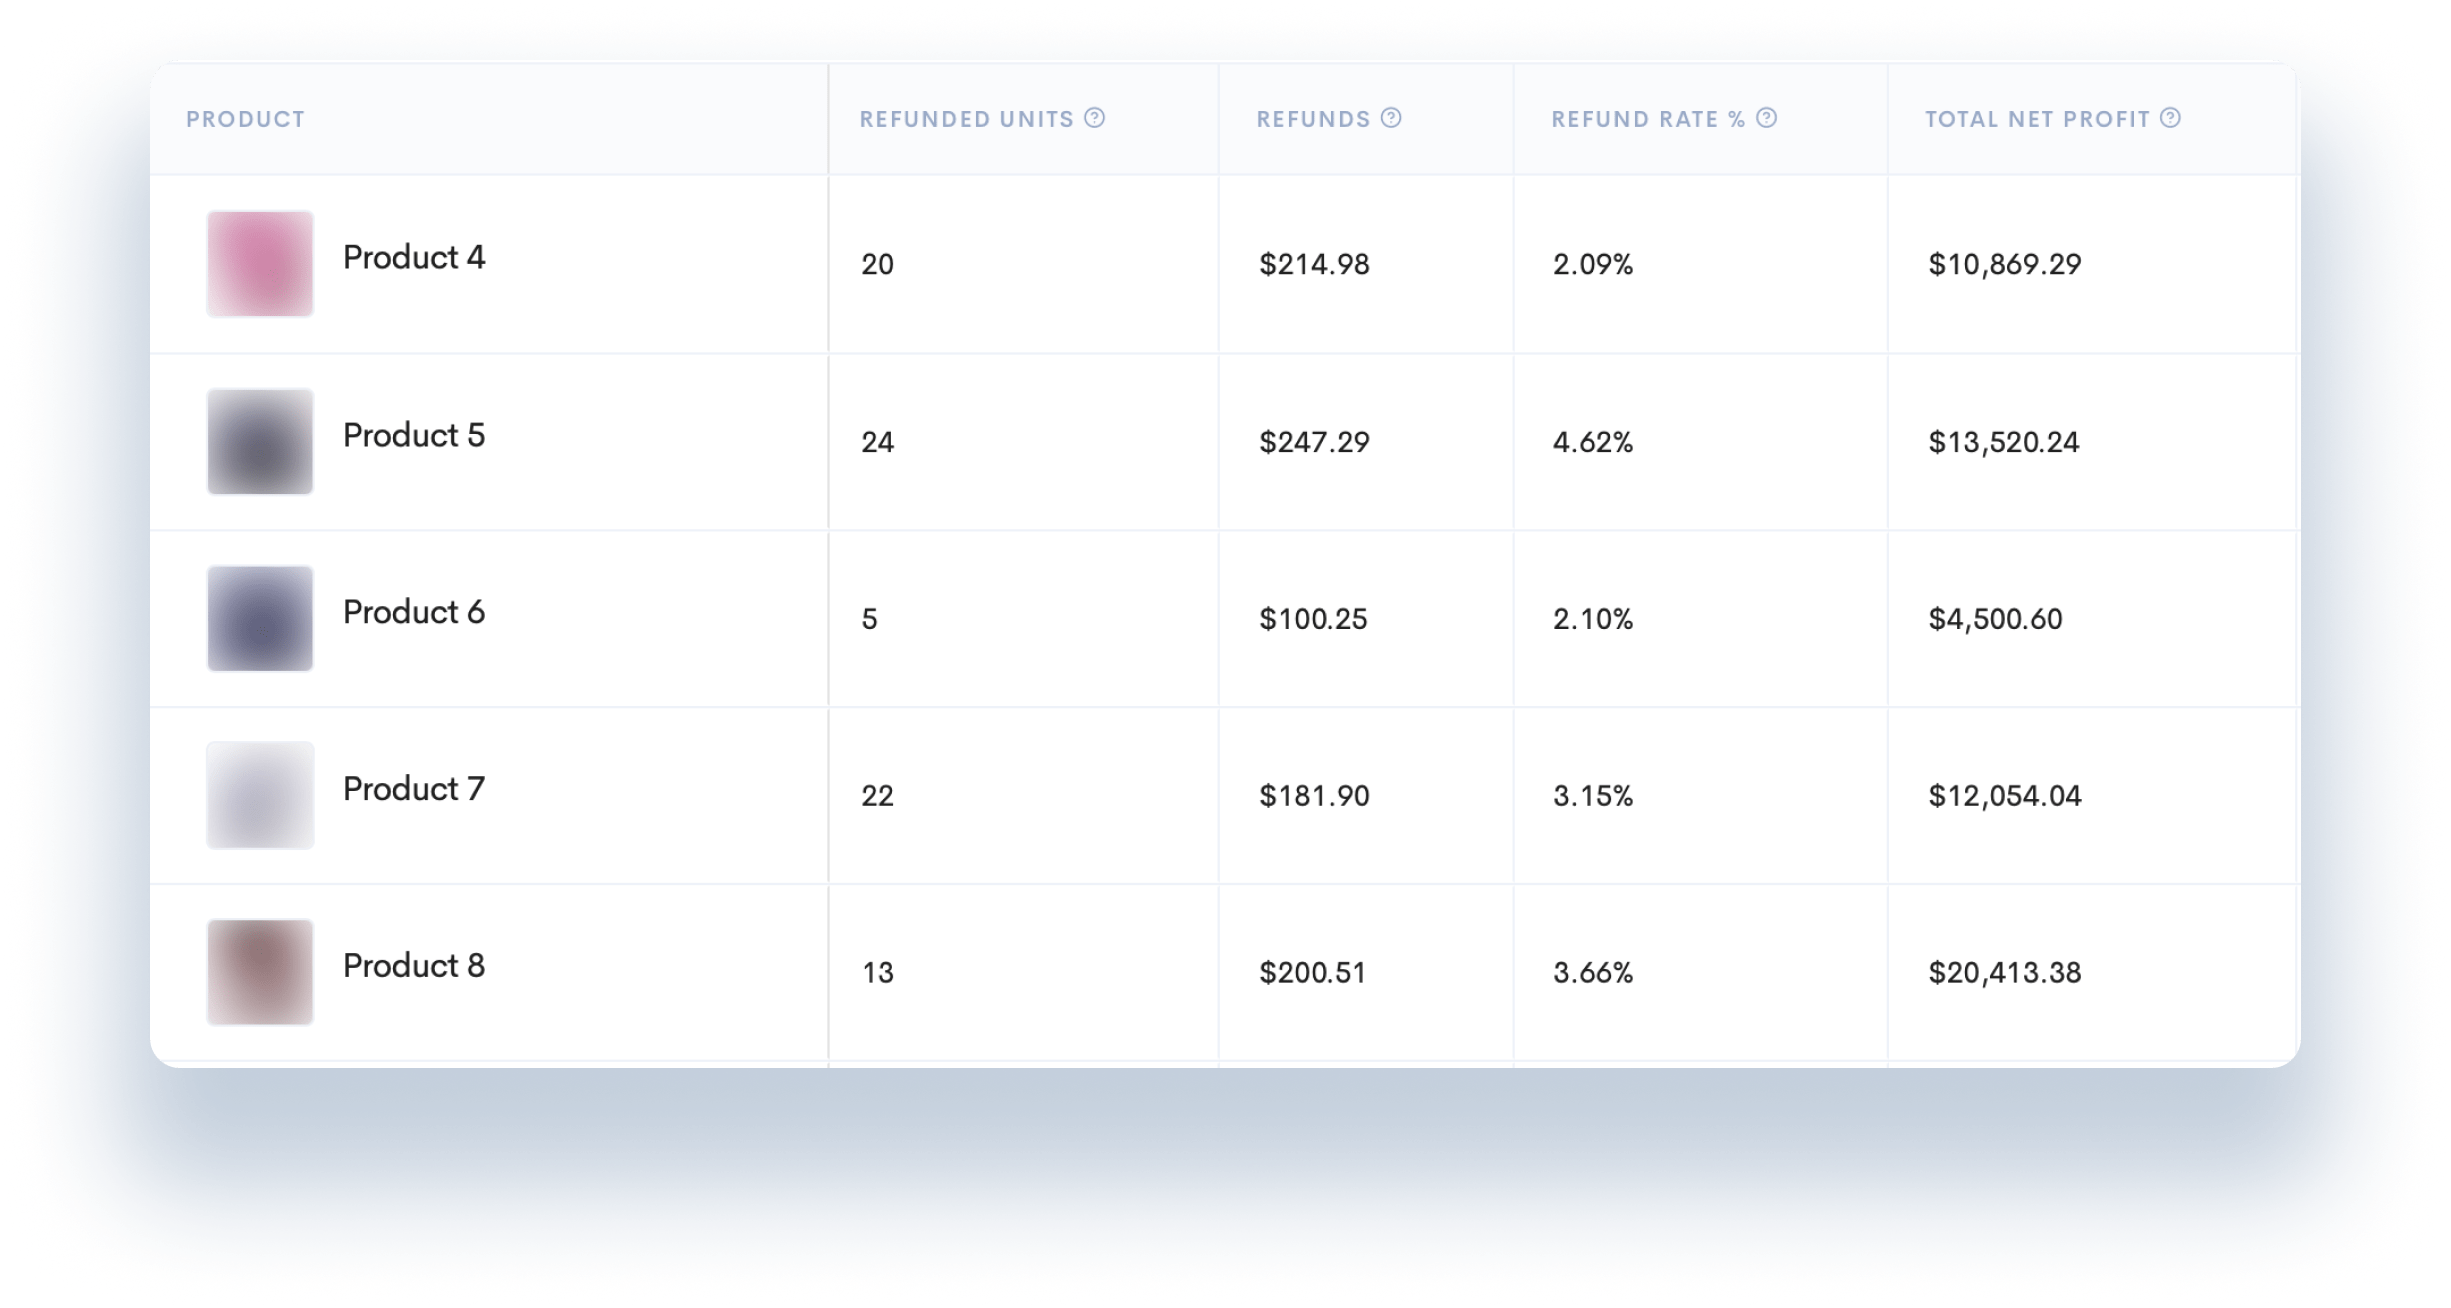

Understand refund patterns to improve product quality and customer satisfaction.
Analyze the percentage of SnS orders refunded to identify and address issues.
Monitor the total number of SnS units refunded to identify and resolve product issues.

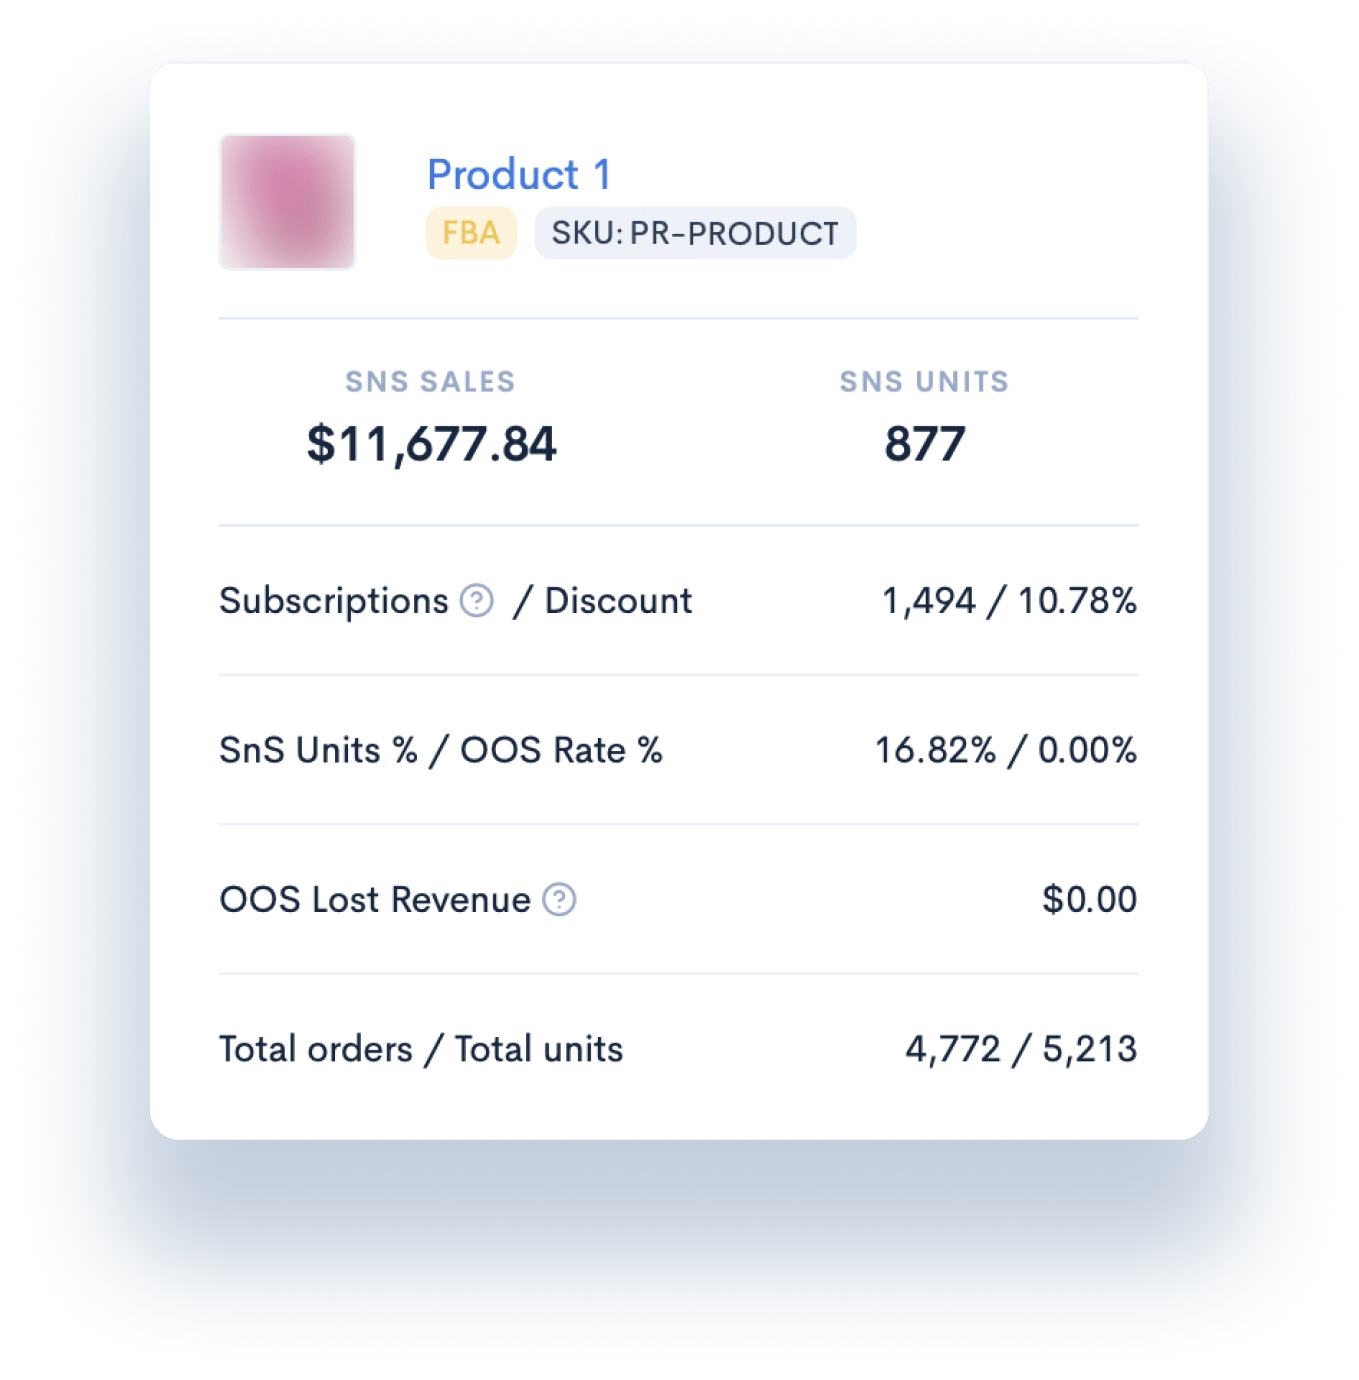
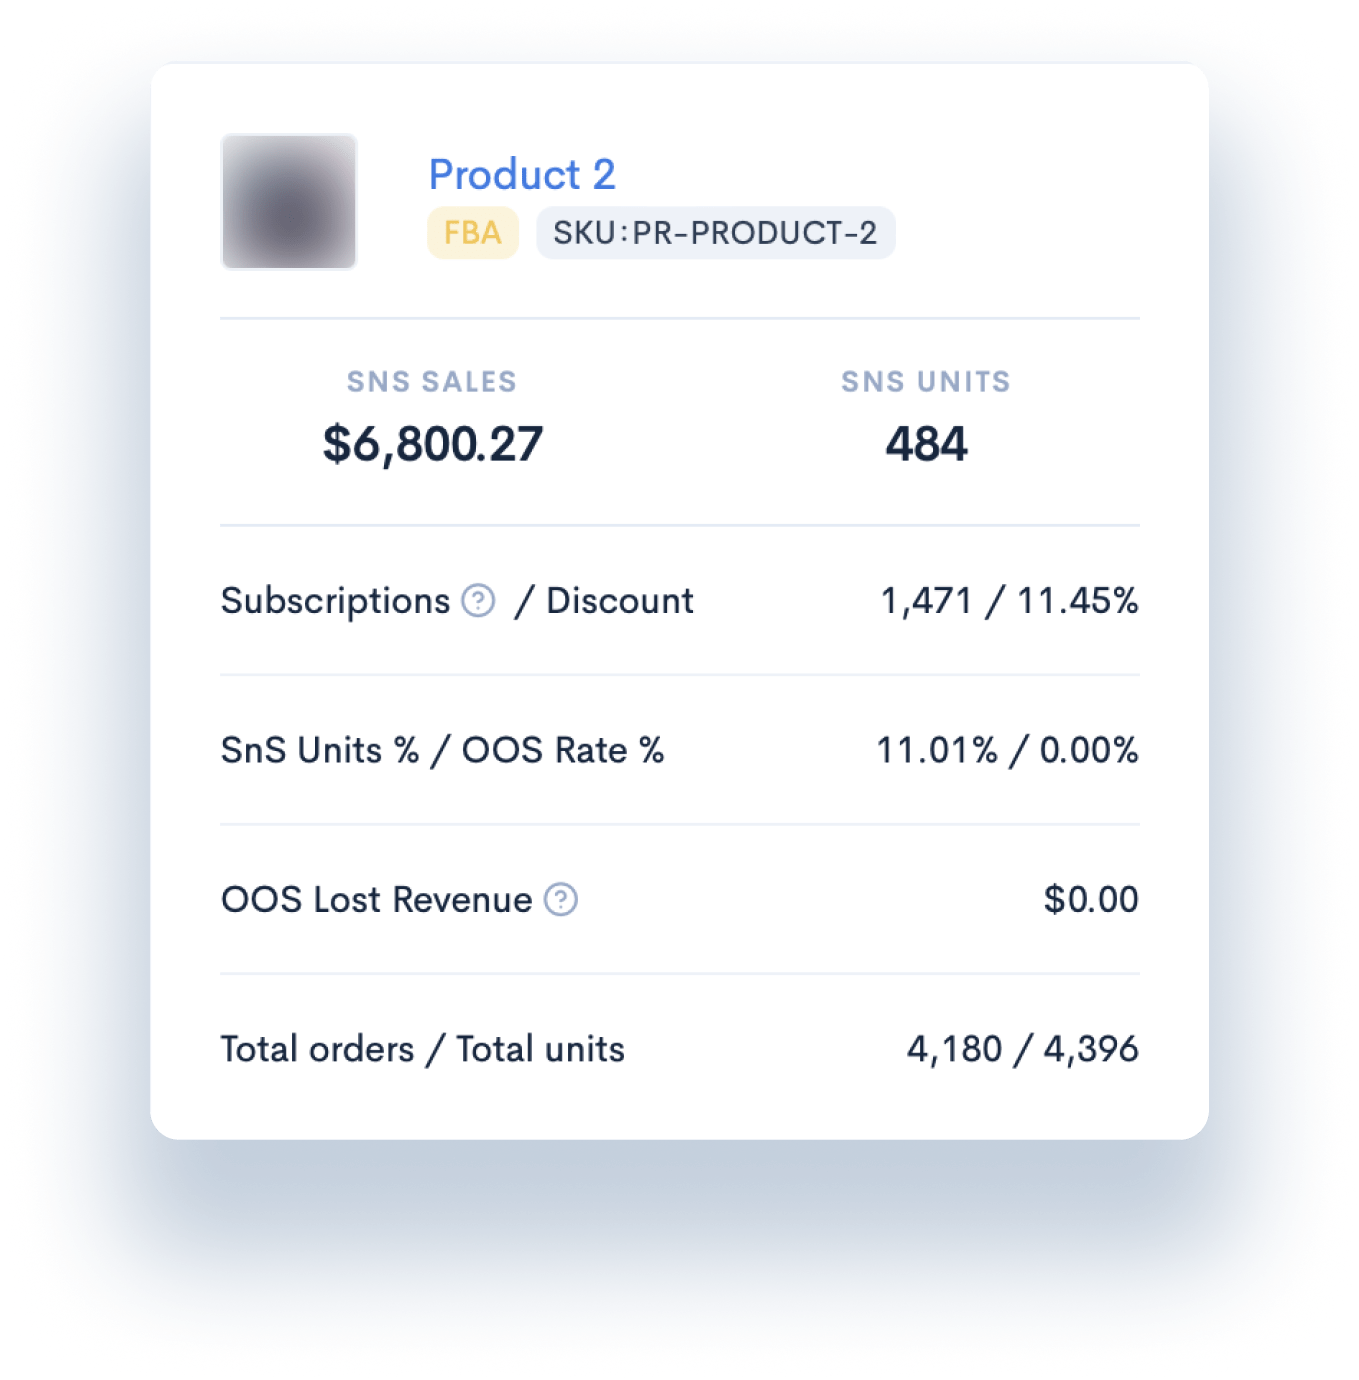
Unlock the full potential of your Subscribe & Save program with advanced performance metrics.
Evaluate the impact of subscription discounts on sales.
Measure SnS units percentage and OOS rate percentage.
See OOS lost revenue to understand missed opportunities.
Review total orders to gauge overall program performance.
